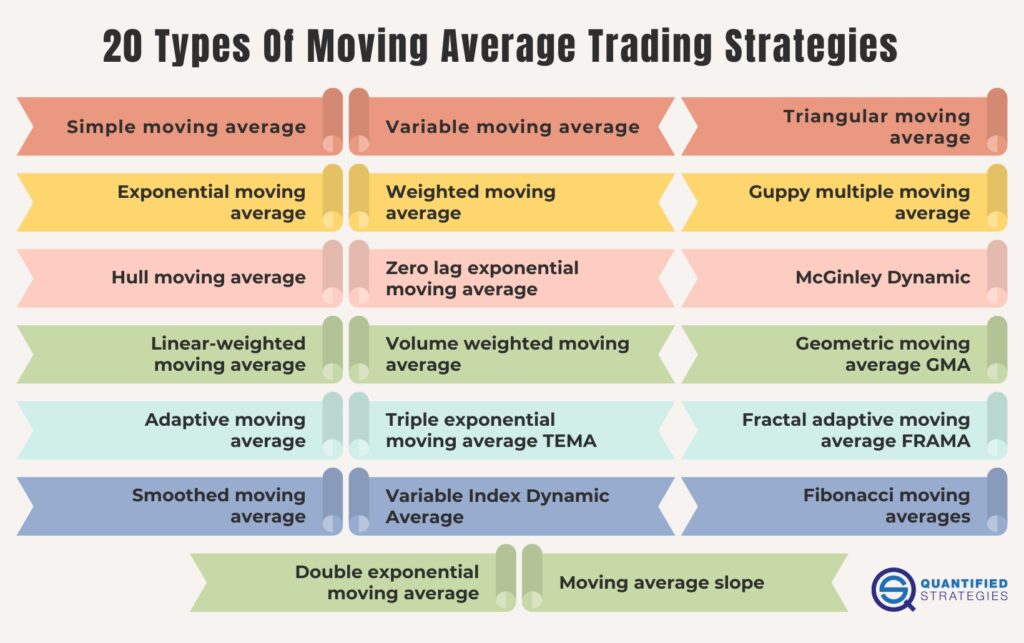
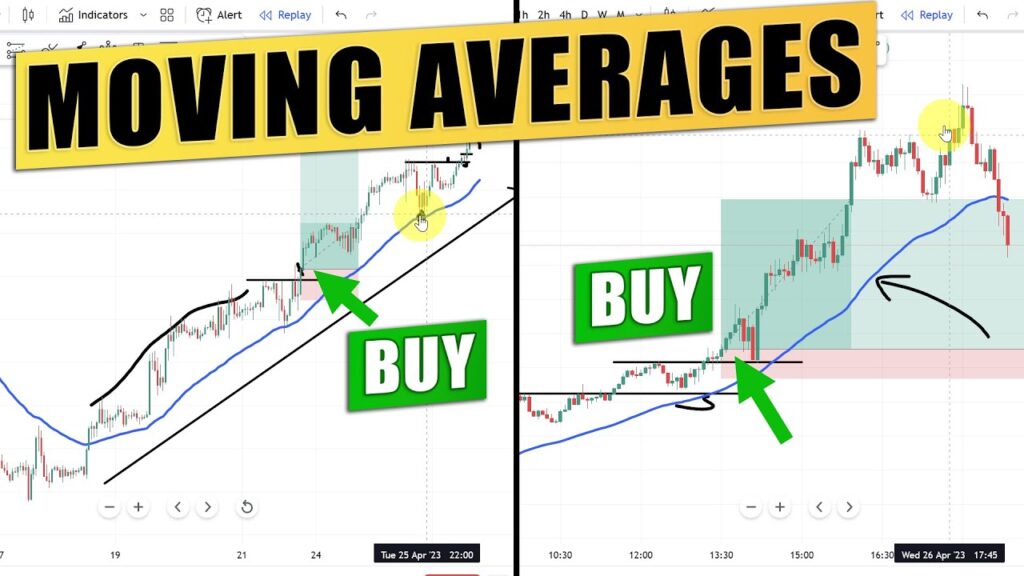
In the world of trading, moving averages play a pivotal role in helping traders identify trends, assess price momentum, and make informed decisions. Moving averages are a popular technical analysis tool that smooth out price data to identify underlying trends more effectively. Here, we delve into 20 types of moving average trading strategies that every trader should consider when refining their market analysis.
1. Simple Moving Average (SMA)
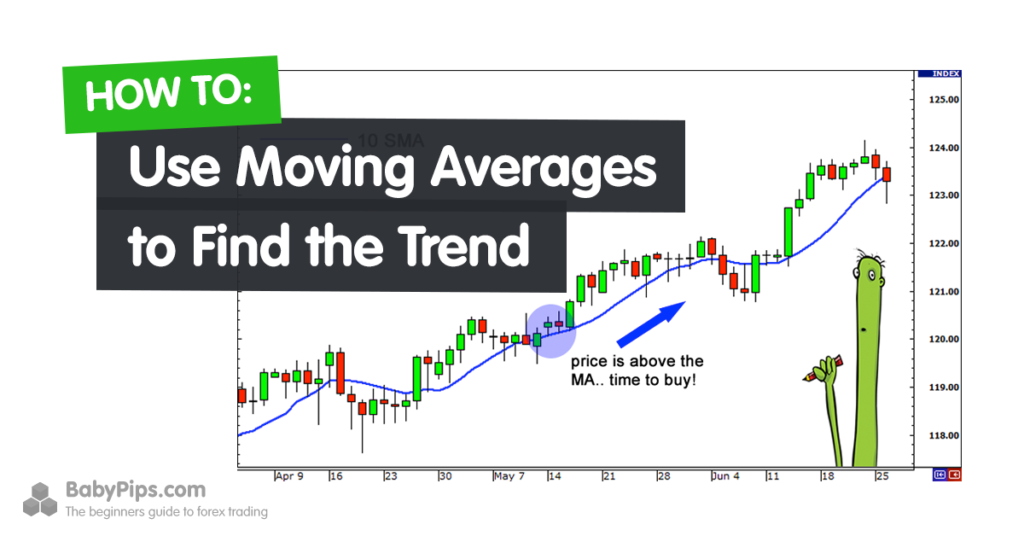
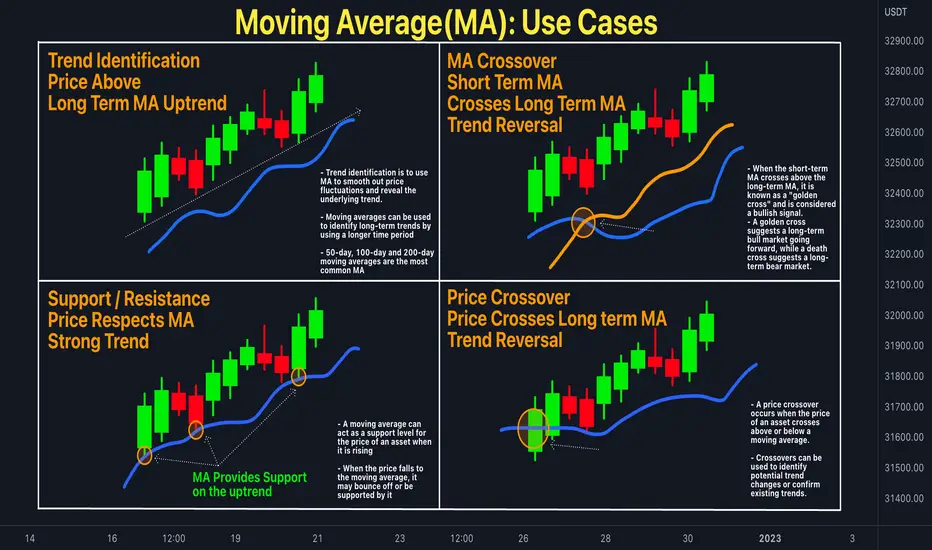
The Simple Moving Average (SMA) is the most basic and commonly used type of moving average. It calculates the average of a security’s price over a specific period, such as 20, 50, or 200 days. Traders use the SMA to identify long-term trends by smoothing out price fluctuations. The SMA is best suited for identifying overall trends and potential reversals when combined with other indicators.
2. Variable Moving Average (VMA)
The Variable Moving Average (VMA) adapts to market conditions by adjusting its smoothing factor. Unlike traditional moving averages, which use a fixed number of periods, the VMA allows traders to modify the period dynamically based on price volatility. This makes the VMA a flexible tool that can respond quickly to market changes, offering better responsiveness in volatile conditions.
3. Triangular Moving Average (TMA)
The Triangular Moving Average (TMA) is a variation of the simple moving average that places more weight on the middle of the period. It is calculated by averaging the SMA of a security’s price for a given period. TMA is useful for smoothing out price data and can help traders identify medium- to long-term trends more clearly. However, its slower response time to price changes makes it less useful for short-term trading.
4. Exponential Moving Average (EMA)
The Exponential Moving Average (EMA) places greater weight on more recent price data, making it more sensitive to recent price changes than the SMA. The EMA is particularly popular among short-term traders due to its quicker response time. Traders often use the EMA to confirm trend direction and gauge momentum. The 12-day EMA and 26-day EMA are two of the most widely used periods in the market.
5. Weighted Moving Average (WMA)
The Weighted Moving Average (WMA) gives more importance to specific data points within the period by assigning a weight to each value. This makes the WMA more responsive to price movements compared to the SMA, but less so than the EMA. The WMA is especially helpful when traders need to emphasize more recent prices while still incorporating the overall trend.
6. Guppy Multiple Moving Average (GMMA)
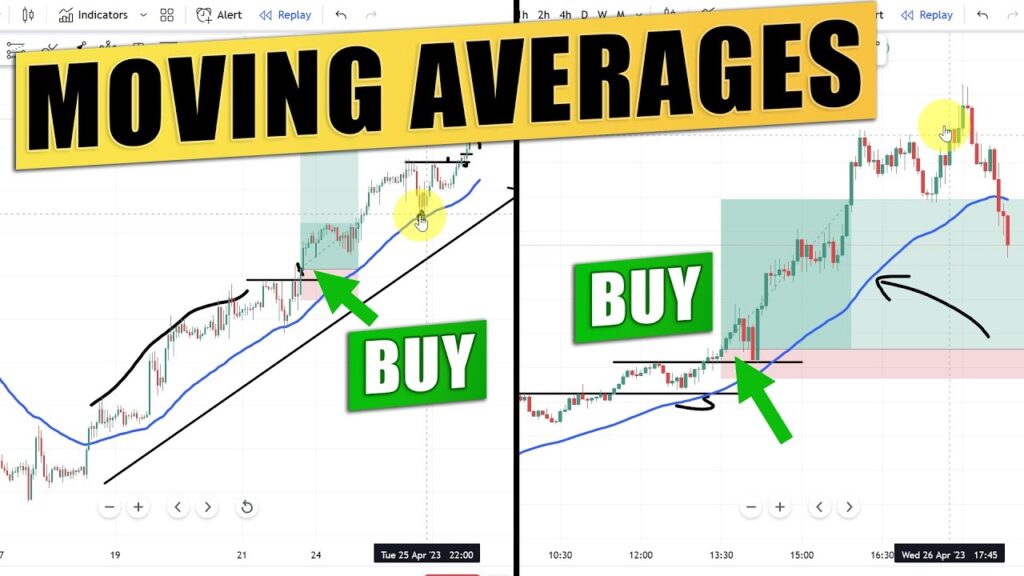
The Guppy Multiple Moving Average (GMMA) consists of two groups of EMAs—short-term and long-term. The short-term EMAs react quickly to price movements, while the long-term EMAs provide insight into the overall market trend. The GMMA is a highly effective strategy for identifying potential trend reversals and confirming the strength of a trend. Traders often use the GMMA to spot breakouts and decide when to enter or exit trades.
7. Hull Moving Average (HMA)
The Hull Moving Average (HMA) is designed to reduce lag and smooth out price fluctuations faster than other moving averages. It utilizes a weighted moving average in its calculations, which gives it a high level of responsiveness to recent price movements. The HMA is particularly popular among traders who want to combine the responsiveness of an EMA with the smoothness of an SMA.
8. Zero Lag Exponential Moving Average (ZLEMA)
The Zero Lag Exponential Moving Average (ZLEMA) is a modified version of the EMA that seeks to eliminate lag in price action. It does this by adjusting for price noise and focusing more on the actual trend direction. The ZLEMA is often used in fast-moving markets, providing traders with a smoother indicator for trend confirmation and faster signal generation.
9. McGinley Dynamic (MD)
The McGinley Dynamic (MD) is a more advanced moving average that adjusts itself according to the speed of the market. Unlike traditional moving averages, the MD adapts to changes in volatility, ensuring that it responds appropriately to both fast and slow price movements. This unique property makes it an excellent tool for traders seeking more accurate signals in rapidly changing market conditions.
10. Linear Weighted Moving Average (LWMA)
The Linear Weighted Moving Average (LWMA) assigns weights to price data in a linear fashion. Each price point is multiplied by a predetermined weight, and the sum of these weighted prices is divided by the total weight. The LWMA is particularly useful when you want to give more importance to recent price movements, offering a better reflection of short-term trends compared to other moving averages.
11. Volume Weighted Moving Average (VWMA)
The Volume Weighted Moving Average (VWMA) takes into account both price and volume, giving greater weight to periods with higher trading volume. This moving average is particularly useful in assessing the strength of a trend since higher volume often correlates with stronger market conviction. The VWMA can help traders identify trends that are supported by high trading volumes, signaling greater market interest.
12. Geometric Moving Average (GMA)
The Geometric Moving Average (GMA) is another form of moving average that focuses on geometric means rather than arithmetic ones. This approach smooths price data while accounting for compounding effects. The GMA is considered more accurate than the SMA when analyzing market trends over a long period, as it reduces the impact of extreme price movements.
13. Adaptive Moving Average (AMA)
The Adaptive Moving Average (AMA) dynamically adjusts its sensitivity based on market volatility. It is particularly useful for traders who want a moving average that responds quickly to significant market shifts while maintaining stability in less volatile periods. The AMA can be a crucial tool for traders who want to filter out noise and focus on the most meaningful market movements.
14. Triple Exponential Moving Average (TEMA)
The Triple Exponential Moving Average (TEMA) is a combination of three exponential moving averages that helps eliminate lag and reduce noise in price data. The TEMA provides a smoother curve compared to a standard EMA, making it a favorite for traders who need an indicator that reacts quickly but with minimal distortion. It is ideal for traders focusing on fast, precise signals.
15. Fractal Adaptive Moving Average (FRAMA)
The Fractal Adaptive Moving Average (FRAMA) adjusts its sensitivity based on the fractal structure of price data. This adaptive property allows the FRAMA to respond effectively to both trending and consolidating market conditions. Traders use the FRAMA to identify periods of high volatility and determine the most appropriate entry or exit points.
16. Smoothed Moving Average (SMA)
The Smoothed Moving Average (SMA) is a variation of the SMA that applies additional smoothing to reduce noise. By extending the period over which the average is calculated, the SMA gives a clearer picture of the market trend, making it an effective tool for identifying long-term trends and minimizing the impact of short-term price fluctuations.
17. Variable Index Dynamic Average (VIDYA)
The Variable Index Dynamic Average (VIDYA) is another adaptive moving average that adjusts its sensitivity based on market volatility. The VIDYA uses a dynamic factor to modify its smoothing constant, which makes it more responsive to changes in price behavior. This advanced moving average is favored by traders who want to smooth trends while maintaining quick response times during volatile market conditions.
18. Fibonacci Moving Averages
The Fibonacci Moving Averages are based on the famous Fibonacci sequence, which is used in various technical indicators. These moving averages typically use periods derived from Fibonacci numbers, such as 8, 13, 21, and 34. The Fibonacci Moving Averages can help traders identify potential support and resistance levels, as the Fibonacci sequence is often seen as reflecting natural market behavior.
19. Double Exponential Moving Average (DEMA)
The Double Exponential Moving Average (DEMA) reduces lag by applying two EMAs to the price data, providing a smoother response. The DEMA is designed to offer more accurate signals and quicker reactions to price changes, which is particularly beneficial for day traders and scalpers who rely on precision in fast-moving markets.
20. Moving Average Slope
The Moving Average Slope is a unique strategy that measures the angle or slope of the moving average line. By analyzing the slope, traders can determine whether the market is trending upward or downward and assess the strength of that trend. A steeper slope indicates a stronger trend, while a flatter slope suggests consolidation or trend reversal.
Conclusion
Each of the 20 moving average trading strategies discussed here offers a unique approach to understanding price trends and market behavior. By incorporating the right moving average into your trading strategy, you can enhance your ability to make informed decisions and improve your market analysis. Whether you prefer quick responses to market changes or smooth long-term trends, there is a moving average strategy that suits your trading style and objectives.
